The purpose of this lab is to demonstrate the advantages of Ground Control Points or GCPs when doing image processing. To do this we first ran a dataset of 342 photos that we took earlier in the semester in Pix4D without any GCPs. Once this was done running, we then ran the same dataset but this time with GCPs so we could compare accuracy and results. This will give us an idea of how important these GCPs really are and why they should be implemented into all aspects of image processing.
Our area of interest of this dataset was two small drainage ponds south of South Middle School (Figure 1). The South Middle School community garden was just to the North of our study area and we set up home base at the Northwest corner (Figure 2). We conducted this small study on September 30th from 4-7pm.
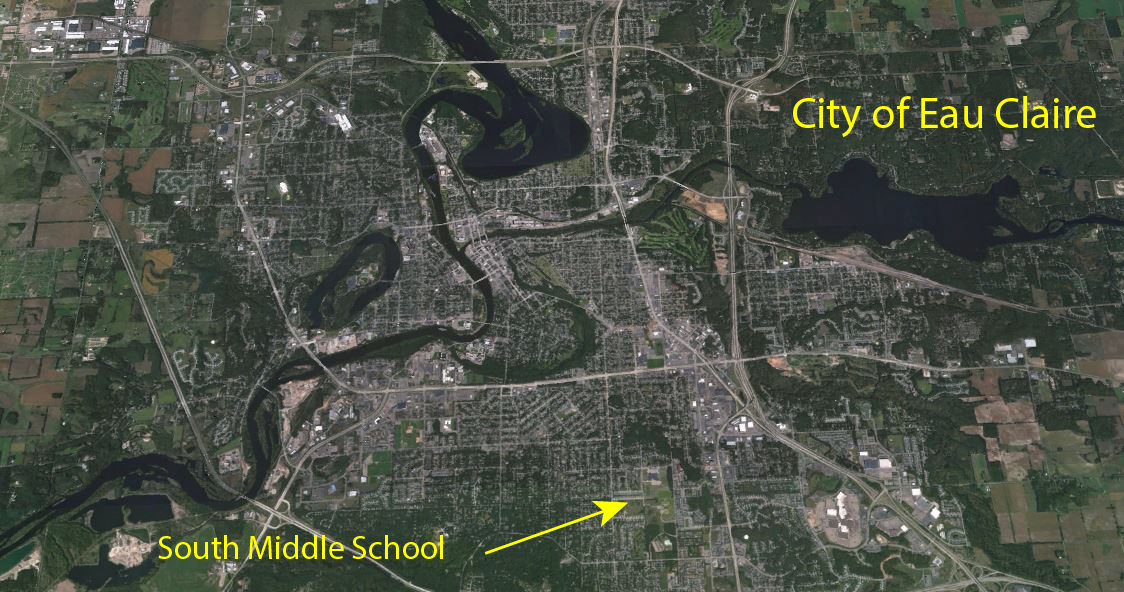 |
| Figure 1: South Middle School is located south of Highway 12 and west of Highway 93 |
 |
| Figure 2: Map showing where our home base and study area were in relation to South Middle School
|
The basis of this activity is in the use of the software, however it is important to note that this would not have been possible without first collecting the GCPs and gathering the imagery. If you would like to know more about how we went about the collection of this data then you can look at my blog here: http://nikandersonuas.blogspot.com/2015/10/gathering-ground-control-points.html
Since this blog is focused on adding the GCPs I will also abstain from going in depth about the Pix4D software, but once again if you would like to learn more about Pix4D and how they process imagery, you can read my blog here http://nikandersonuas.blogspot.com/2015/11/pix4d-processing-and-analysis.html
Now that you have an idea of how we collected the GCPs and how the software works, we can dive into the addition of GCPs into our workflow so we can demonstrate the benefit of having them. We start the process the same as if we didn't have any GCPs. So basically adding the photos, checking the coordinate system, making sure our images are geolocated. Once we have everything set up to process we then go to the tie point manager and begin the process off adding the GCPs. We do this by importing a file that has the latitude, longitude, and elevation of our GCPs. This finds the images in which those coordinates exist and gives them to us in a list form. We then go through that list and begin the tedious process of selecting the middle of our GCP in the image with a click of the mouse. Every click that we make then makes the process a little easier and the software begins to narrow down where the exact location of the GCP is located. I manually selected around 9 or 10 images for each GCP and let the software automatically correct itself and pick the others. Each time I was done selecting images for a GCP, I would optimize that GCP which would run a tool that selected even more pictures for each GCP (Figure 3).
 |
| Figure 3:A screenshot of the GCP selection process of which I would then optimize. |
Discussion/Critique
Overall I think the software is once again very easy to use. It is a little tedious to select all the images for the GCPs but once you do that, you are going to end up with a much better and more accurate product. In Figure 4 below you can see my final orthomosaic that I created in ArcMap from the processing that was done in Pix4D.
 |
| Figure 4: Map showing the final result of the GCP version of the Pix4D processing. |
As you look at the image above you can see a very high definition mosaic that it is geometrically othrorectified by the GCPs. To see a true comparison of this image without the help of GCPs, look at Figure 5 below.
 |
| Figure 5: Look closely at this image and you can see that I made the image on top transparent. |
No comments:
Post a Comment