Using UAS and the resulting DSMs we can get from UAS imagery we can run many analytical tools. One of the more practical reasons for using UAS is calculating volumetrics. The need for volumetrics can be found in many places but we are focusing mainly on calculating the volume of frac sand in piles throughout a mine. This information can be invaluable to the mining company as they can now know how many cubic meters of sand they are moving each day. This process can be done one of three ways, all of which I will touch on in this blog.
Methods:
To test out the three methods we selected three aggregate piles to use for analysis on all three methods. To begin we started with the Pix4D method which consisted of running the photos through the processing software and then going back through and drawing polygons around the piles so that the software can calculate the volumetrics by using the DSM that was just created. The piles were numbered 1-3 from left to right (Figures 1,2,3,and 4).
 |
| Figure 1: Example of the selection that we drew around each Polygon to calculate the volume |
 |
| Figure 2: Screenshot of the First pile polygon |
 |
| Figure 3: Screenshot of the Second pile polygon |
 |
| Figure 3: Screenshot of the Third pile polygon |
The next method was through ArcMap and consisted of calculating the volume through the use of a surface volume. For this we had to extract by clip the area around the sand piles so that we had a specific clip of the sand piles but still in raster format. The next step was to calculate the elevation of the top of each of the piles so we had that data for the volume tool. Once we had this surface all set up, we ran the surface volume tool and got the following values listed below in Figures 4-6.
 |
| Figure 4: Screenshot of the first surface volume |
 |
| Figure 5: Screenshot of the second surface volume |
 |
| Figure 6: Screenshot of the third surface volume |
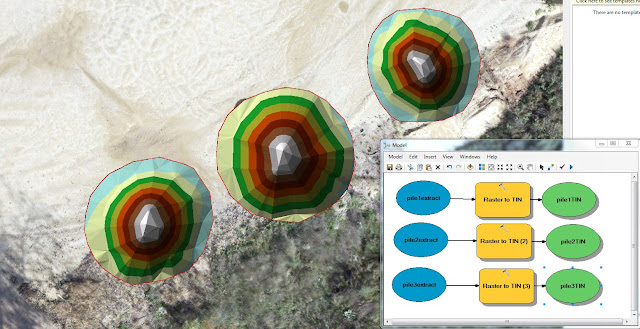
The final to calculate volume is through creating a TIN and using the polygon volume tool. To do this we first had to take the raster (DSM) and run a raster to TIN tool (Figure 7) so we could have our Triangular Irregular Network. We also had to add the mean surface elevation as a Z value before finishing the process. However, once we did that we could run the polygon volume tool to come up with the resulting table below (Figure 8).
 |
| Figure 7: Screenshot of our three piles in the TIN format with a sideshot of our data flow model showing the part of the process into making the raster a TIN |
 |
| Figure 8: Screenshot of all three of the TIN/polygon volumes |
Results/Discussion:
We can see from these three derivatives of volume models that they are not consistent and vary quite a bit (Figure 9). This is most likely the result of user error. These values look incorrect to me as the with the actual size of the sand piles there is no way that they are only 10 meters cubed. But regardless, for right now its all about the process, not the product. The Pix4D was confusing but should be the most accurate since we are doing it right in their software and they only calculate the volume of the pile, not the surrounding flat areas around the pile. Raster surface is great but you need a baseline flat surface in order to calculate its volume. This is because it takes the surface of the pile but we give it a baseline elevation value and if that elevation is wrong or not constant throughout the whole object, then it will be invariably incorrect. Finally with TIN you can see from Figure 10 below that it can be the longest process but you can also see from the values chart that the three piles we calculated had the closest relation to each when using the TIN. You can have the same problem with the TIN as you did the Raster Surface, if you don't add the surface information correctly, this will invariably corrupt your data accuracy.
 |
| Figure 9: Table showing all three methods put together |
 |
| Figure 10: Screenshot of my data flow model used to calculate the TIN volume in the last method. |
Conclusion:
What I can take away from this is that in many aspects of Geospatial technology there can be different ways of collecting data and running through processes. It is up to the geographer to take these different methods and realize which methods are more accurate and which methods are better for different applications. Just because you have an object that you need to calculate the volume on doesn't mean that you can use all of these methods but you can most likely use at least one and knowing how to differentiate between the three is the name of the game and what can separate a basic geographer from an exquisite one.
No comments:
Post a Comment